Archive
Set Up Rsyslog and LogAnalyzer on CentOS Linux 5.5 for Centralized Logging
LogAnalyzer is a web based program that allows you to view event messages from a syslog source within your web browser. Rsyslog is a drop in replacement for the syslog daemon that among other things allows syslog messages to be saved in a MySQL database. Combining these two great programs and directing other network devices to forward syslog messages to a central server allows for a very powerful solution for searching and archiving event messages that occur throughout your network environment. In this example I will install rsyslog on a CentOS Linux 5.5 server to aggregate and collect syslog messages and configure LogAnalyzer on the same server to allow for a user friendly interface for viewing and searching through these messages.
First we need to install some required RPM’s. Since I am running LogAnalyzer, Rsyslog, and MySQL all on the same server I will install these required packages:
# yum install httpd php mysql php-mysql mysql-server wget rsyslog rsyslog-mysql
Now we’ll make sure MySQL and Apache are configured to start automatically and start them up:
# chkconfig mysqld on

# chkconfig httpd on

# service mysqld start

# service httpd start
Read more…
Monitoring Windows 2008 R2 Event Logs with Snare and Syslog
So now that you’ve deployed some brand spankin’ new Windows 2008 R2 servers you probably want to start gathering some information on their condition and monitor their security. Syslog is a very good way to gather the logs from a large number of servers and direct them to a central site for analysis. In this post we’ll make use of the Snare EventLog Agent to collect events from the Windows Event Log service and forward them to a centralized syslog server. Since the events that are logged to the Event Log do not generally conform to the syslog standard some manipulation of the messages may be necessary on your syslog server.
In this example I will be installing the Snare EventLog Agent on an Active Directory domain controller so that I can monitor logon/logoff failure events that occur with my domain user accounts. My central syslog server will be running on a CentOS Linux host using the syslog daemon rsyslog. There are also many syslog servers available for Windows if you choose to go that route. Kiwi is one with a nice interface but the full featured version is payware. Your choice of a syslog server to collect your messages should be immaterial to this discussion as the configuration steps should be the same with the Snare Agent.
First let’s start by installing the Snare Agent software. You’ll want to download the version for Windows Vista and above here. Logon as administrator on your 2008 R2 server and run the install file.
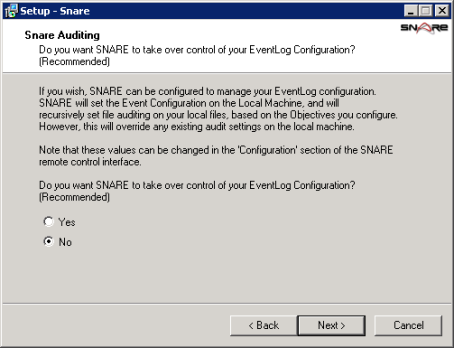
Proceed with the installation and accept the defaults until you get to the “Snare Auditing” screen.
The Snare Auditing screen allows you to give Snare the access necessary to edit the auditing settings on your server to conform to the objectives that you configure with the agent. I’m generally paranoid about anything too automatic (especially on a domain controller) so I’ll select No. This means that I’ll need to manually specify the auditing settings needed so that events are created in the Event Log. Click Next.
If you want to configure higher security you can select one of the “Yes – with password” options for the Snare web configuration interface. By default the user/password combo is snare/snare. I’ll keep the default, no password is okay for me because the only access to the web interface is permitted on the local machine. Click Next.
Run through the rest of the install keeping the default settings.
Monitoring Windows Server 2008 R2 with SNMP and Cacti
So you have a new Windows Server 2008 R2 installed and now you’d like to start gathering statistics about how it’s performing. The SNMP protocol is a great way to get started. In this tutorial I will install the SNMP agent service on a Windows server and configure it to allow queries from a SNMP based management server. On the management server I will use a tool named Cacti that can collect this SNMP information and generate graphs from it in a fairly easy way. I will assume that you have a server with Cacti already set up. If not, details on how to set up an instance of Cacti on a CentOS Linux server can be found here.
Install and Configure Windows SNMP Agent
Okay first of all let’s install the Windows SNMP agent service.
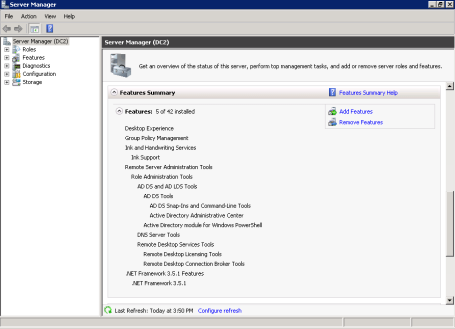
Start Server Manager.
Scroll down to the Features Summary section and click Add Features.
Under Features open up SNMP Services and check SNMP Service. Click Next.
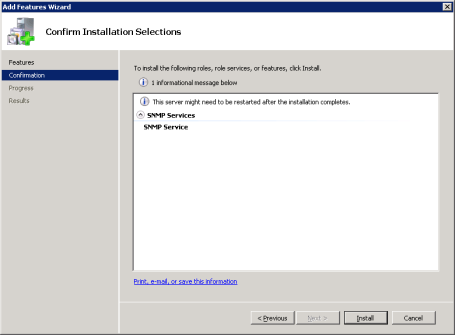
Click Install at the confirmation screen, then click Close when the install is complete.
Monitoring Authentication Attempts on Cisco Routers with Syslog
One of great things about the syslog logging standard is the capability to collect system notifications from a variety of network hosts and direct them to a central store for analysis. In this demo I will configure a Cisco router to log system messages using syslog to a central Linux server. Specifically I am interested in logging authentication attempts to the router.
My preferred syslog daemon that I will be running on my Linux syslog server is rsyslog. There are also many syslog servers available for Windows if you choose to go that route. Kiwi is one with a nice interface but the full featured version is payware. Your choice of a syslog server to collect your messages should be immaterial to this discussion as the configuration steps should be the same on a Cisco router.
Configure Syslog Server to Accept Messages
To start, we’ll make sure that the syslog server is configured to accept messages from the IP address of your router. This should be the IP of the interface on the router that is closest to the syslog server. For example, suppose the router has an external and an internal interface. Our syslog server is on the same LAN that the internal interface is connected to. The syslog server should be configured to accept messages from the IP address of the internal interface. We also have the option to manually configure the interface the syslog messages are sourced from.
The syslog standard sends log messages identified with a certain facility and severity. Generally the facility is used to identify the message as coming from a particular program or service. This has more use when the source of the syslog messages is a full blown computer server. In the case of Cisco routers by default syslog messages are sent marked as coming from the “local7” facility, so we need to make sure that the syslog server accepts messages from this facility. The source facility can be changed if you so desire.
In addition, syslog messages have a severity attached which gives information on the priority or urgency of the message. If you are familiar with syslog you know that higher numbers represent lower severity levels. Here is a list of the minimum severity levels that a Cisco router can be configured with which to send messages to the syslog server.
Router(config)#logging trap ?
<0-7>          Logging severity level
alerts         Immediate action needed           (severity=1)
critical       Critical conditions               (severity=2)
debugging      Debugging messages                (severity=7)
emergencies    System is unusable                (severity=0)
errors         Error conditions                  (severity=3)
informational  Informational messages            (severity=6)
notifications  Normal but significant conditions (severity=5)
warnings       Warning conditions                (severity=4)
Monitor Cisco Routers with Cacti and SNMP
Recently I had the desire to start monitoring the statistics of our internet router. The main thing that I wanted to measure was the volume of traffic passing in from and out to the internet because the ISP limits the amount of data passing over the connection for each month. With a tool such as Cacti we can collect these statistics via SNMP and graph them in a fairly simple way. For details on how to set up an instance of Cacti on a CentOS Linux server go here.
Configure SNMP on Cisco Router
Go into global config mode:
cisco1# conf t
First we’ll set up read only access for a community string named “TestCommunity”. The community string functions like a password and only allows access for management stations configured with the same string name. Bear in mind that this value is passed over the network unsecured so do this only on private networks.
cisco1(config)# snmp-server community TestCommunity ro
For now Cacti will only need read access to get SNMP access stats. Make a note of the community string because we’ll need to configure the Cacti server with this later.


Recent Comments